Economic Insider

Anthropic AI Economy Model Maps GDP and Job Risk by 2030


Anthropic AI Economy Model puts a sharp 2030 trade-off into view: U.S. output rises in every scenario the company modeled, while knowledge-worker pay and employment outcomes vary much more widely. The scenario explorer shows how GDP growth, job switching and wages can move in different directions as AI capability and workplace use expand.

Key Takeaways

  • Anthropic’s September 2026 model puts 2030 U.S. GDP 1.6%, 8.3% or 32.4% above a comparable no-AI economy, depending on the scenario.
  • In the substantial case, unemployment reaches 4.6% and knowledge-worker wages are essentially flat. In the extreme case, unemployment approaches 12% and knowledge-worker wages fall by more than 10%.
  • Labor’s share of GDP falls from 59.4% in the modest case to 45.2% in the extreme scenario.
  • BLS projections show strong growth in several technical occupations while some administrative roles decline.
  • Stanford payroll research finds no economy-wide AI job collapse, but a widening employment gap for workers ages 22 to 25 in highly exposed occupations.

Anthropic AI Economy Model Puts Growth and Pay on Different Paths

Anthropic released Version 1.0 of its economic scenario explorer in September 2026, setting out three possible U.S. paths through 2030. The company describes the tool as scenario planning rather than a forecast. Outcomes change with assumptions about AI capability, adoption, autonomy, productivity and how quickly workers can move between occupations.

The GDP range is wide. Anthropic estimates 2030 output at $34.1 trillion in 2025 dollars in its modest scenario, $36.3 trillion in the substantial scenario and $44.4 trillion in the extreme scenario. Those totals are 1.6%, 8.3% and 32.4% above comparable economies without AI.

The worker picture separates more sharply as the scenarios become more transformative. Knowledge-worker wages are essentially flat in the substantial scenario and fall by more than 10% in the extreme one. Axios reports that overall unemployment reaches 4.6% in the substantial case and nearly 12% in the extreme case.

The distribution of output also changes. Labor receives 59.4% of GDP in the modest scenario, 56.1% in the substantial scenario and 45.2% in the extreme scenario. Anthropic says the shift can occur because capital becomes more important as AI performs a larger share of tasks, even while total output increases.

Anthropic also surveyed 10,980 Americans in August. The typical respondent’s answers implied an economy about 10% larger by 2030 than it would be without AI, with unemployment around 5%. About 10% of respondents gave answers broadly aligned with the extreme scenario.

Job Switching Becomes the Central Labor-Market Test

Anthropic models occupations as collections of tasks. Some can be assisted by AI, some automated, some remain primarily human and new tasks can emerge as technology changes how work is organized.

That approach makes worker mobility a major variable. Anthropic uses examples such as programmers and customer-service workers moving into less AI-exposed occupations, including nursing and electrical work. Those transitions may require training, relevant experience or longer job searches, especially if many workers change fields at the same time.

The broader AI labor-market warning has increasingly centered on worker preparation and job-transition risks rather than a single headline job-loss number. The distinction matters because displacement does not automatically produce prolonged unemployment if workers can move quickly into roles where demand remains strong.

Current Stanford Digital Economy Lab research adds present-day context without confirming Anthropic’s 2030 scenarios. Using ADP payroll data through June 2026, researchers found no evidence of widespread, economy-wide AI job displacement. They did find that employment among workers ages 22 to 25 in highly AI-exposed occupations stood about 19% below where it would have been if it had kept pace with less-exposed peers of the same age.

Stanford said the gap appears to come mainly from reduced hiring of younger workers rather than higher separation rates. It also found that declines are concentrated more heavily in occupations where AI tends to automate human tasks, while employment is steadier where AI more often complements workers.

Anthropic economist Peter McCrory described the exercise as planning rather than prediction. “Part of the value of doing scenario modeling is so that you can do scenario planning,” he told Axios.

U.S. Job Data Shows Uneven Exposure to AI

Federal projections point to a similarly uneven labor-market picture, although they cover 2024 to 2034 and should not be read as validation of Anthropic’s model.

The Bureau of Labor Statistics projects total U.S. employment to grow 3.1% over that decade. Data scientist employment is projected to rise 33.5%, information security analyst jobs 28.5%, operations research analyst roles 21.5% and software developer employment 15.8%.

Anthropic AI Economy Model Maps GDP and Job Risk by 2030

Photo Credit: Unsplash.com

Several occupations facing stronger automation pressure move in the other direction. BLS projects customer-service representative employment to decline 5.5%, legal secretary and administrative assistant employment to fall 5.8% and procurement clerk employment to decrease 8.7%.

That split helps explain why national employment totals alone may not capture the effect of AI on individual occupations. Rapid growth in technical roles can occur alongside weaker demand in administrative or routine information-processing work. Recent U.S. productivity growth analysis also cautions against assuming that current national productivity gains are already being driven mainly by AI.

The Anthropic AI Economy Model extends that question by testing how occupational changes could interact with wages, unemployment and national output if AI capabilities advance quickly. Its scenarios remain sensitive to assumptions and omit forces including recessions, broad demand shocks, financial-market disruption and highly capable robotics. Current BLS and Stanford data show meaningful shifts in selected occupations, but neither source establishes the model’s most disruptive case as the likely 2030 outcome.

Frequently Asked Questions

What is the Anthropic AI Economy Model?

The Anthropic AI Economy Model is a September 2026 scenario tool estimating how different levels of AI capability and adoption could affect U.S. GDP, jobs, wages and labor’s share of output by 2030. Anthropic presents it as scenario planning, not a forecast.

How much could U.S. GDP change in Anthropic’s scenarios?

Anthropic estimates that 2030 GDP could be 1.6% above a comparable no-AI economy in the modest scenario, 8.3% higher in the substantial scenario and 32.4% higher in the extreme scenario. The figures use 2025 price levels.

Does Anthropic predict mass unemployment by 2030?

No. The model offers several possible outcomes instead of one prediction. Unemployment rises modestly to 4.6% in the substantial scenario and reaches nearly 12% only in the extreme case.

What does current U.S. labor data show about AI and jobs?

BLS projections show strong expected growth in several technical occupations alongside declines in some administrative roles. Stanford payroll research has found no economy-wide AI displacement, although younger workers in highly exposed occupations have fallen behind less-exposed peers.

Why do worker outcomes differ even when GDP rises?

Anthropic’s model allows AI to raise productivity while reducing demand for some forms of human knowledge work. Outcomes depend heavily on whether new tasks emerge and how quickly displaced workers can move into occupations where labor demand remains stronger.

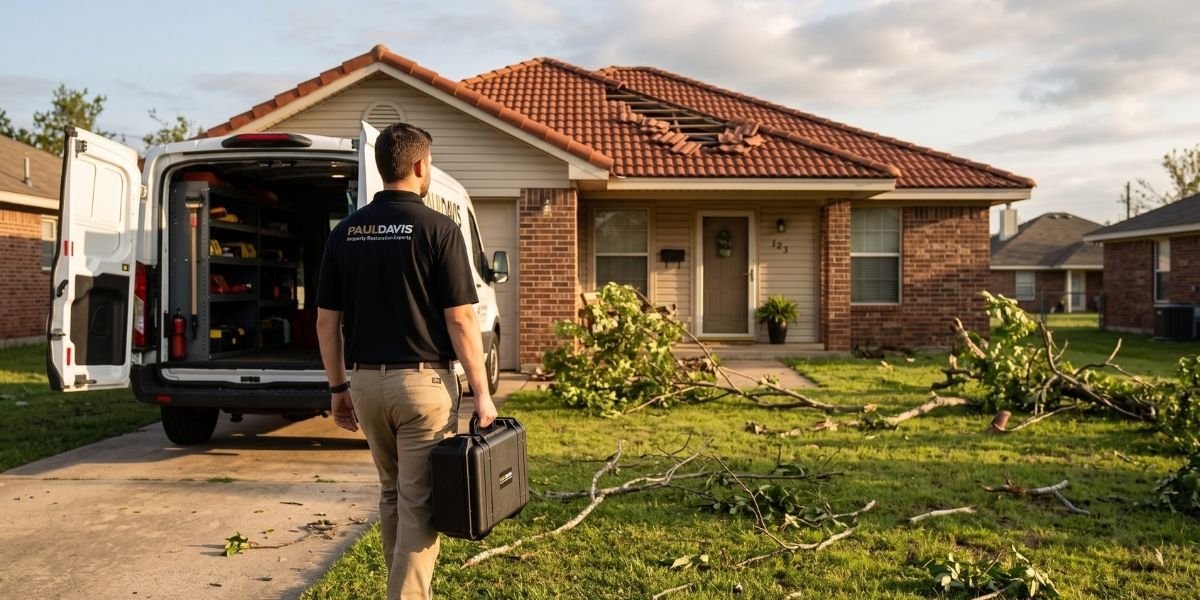
Paul Davis Restoration of Northeast Texas Highlights Rapid Response and Insurance-Aligned Pricing Heading Into Fall

As summer gives way to fall across Northeast Texas, Paul Davis Restoration of Northeast Texas is drawing attention to two of the qualities it says define its work year-round: how quickly it responds to a call, and how it prices projects in a way built around the insurance process rather than simply underbidding competitors.

Built for Speed, Not Just Availability

The company says speed comes from owning the entire job rather than relying on outside vendors. “We’ve built our systems to support rapid response,” the team said, whether that means a 2 a.m. emergency call or a large-loss event affecting a business. Because the company self-performs both mitigation and reconstruction, it says it isn’t waiting on a separate contractor to schedule the next phase of a project once the initial work is done. Detailed documentation and consistent project tracking are meant to keep that momentum going once a job is underway. In Bonham, where storm-related calls tend to rise heading into the fall, that response speed is treated as a baseline expectation rather than a selling point reserved for larger losses.

Pricing Built Around the Insurance Process, Not the Lowest Bid

Rather than competing to offer the cheapest estimate, the company says its pricing strategy is built to move insurance claims forward faster. “We use standardized estimating platforms, speak the language of the adjuster, and build scopes that reduce friction and increase approval speed,” the team said. That approach is meant to reduce the odds of a homeowner facing unexpected out-of-pocket costs later in a project, while also helping insurance partners close files without prolonged back-and-forth over scope disagreements.

A Personality Built on Real People, Not Scripts

Beyond the technical side of the work, the company points to its culture as a differentiator in an industry it says can feel cold or transactional. “In an industry that can feel cold or overly corporate, we show up as real people who care deeply and know our craft,” the team said, describing a tone that stays approachable and honest even in stressful situations, with room for humor alongside technical explanations when it helps put a homeowner at ease. That personality is meant to carry through every interaction, from the first phone call to project completion and beyond.

What Northeast Texas Customers Are Saying

Recent reviews point to responsiveness and follow-through as recurring themes. Jamal K. credited owner Steve Remy directly, saying he worked out a plan that kept the project under budget and calling the company the best in the business for emergency restoration. Taylor H. described unexpected water damage that left the household overwhelmed, noting that Michael and the crew were responsive and reassuring from the first phone call and kept the family updated throughout the entire restoration. Ivan A. praised the team’s handling of a mold demolition project, saying Jermiya and Dacotah walked him through the whole process and treated his home with care.

How fast does Paul Davis Restoration of Northeast Texas typically respond?

The company says it maintains systems built for rapid response at any hour, including large-loss events, made possible by self-performing both mitigation and reconstruction rather than waiting on outside vendors.

How does the company handle pricing with insurance claims?

Rather than competing on the lowest bid, the company builds estimates using standardized platforms that align with how insurance adjusters evaluate claims, aiming to reduce friction and speed up approvals.

What sets the company’s culture apart?

The team describes its approach as personal rather than corporate, aiming to stay approachable, honest, and steady with customers even during high-stress situations.

What areas does Paul Davis Restoration of Northeast Texas serve?

The franchise serves communities across Northeast Texas, including Greenville, Bonham, Sulphur Springs, Paris, Commerce, and dozens of surrounding towns.

Stay Connected With Paul Davis Restoration of Northeast Texas

For project updates and local news, homeowners can follow Paul Davis Restoration of Northeast Texas on Facebook and LinkedIn.

Why Business Owners Get Declined and How to Avoid It Before You Apply

A loan decline rarely comes with a genuine explanation. A business owner submits an application, waits days or weeks, and eventually gets a rejection with little more than a vague reason attached, leaving them to guess what went wrong and whether a different lender might have said yes. This uncertainty has defined business financing for decades, but a free tool now gives business owners a real way to see the same numbers a lender sees before submitting an application.

What Actually Drives a Decline

Declines rarely happen because a business is fundamentally unfundable. More often, they happen because one or two specific factors fall short of a lender’s threshold while the rest of the business’s profile looks genuinely strong. Fundivi’s self-underwriting tool reveals exactly this kind of nuance, evaluating seven distinct factors: average monthly revenue, months in business, personal credit score, average daily bank balance relative to revenue, negative balance days per month, leverage as a share of revenue, and how many financing positions are currently open.

According to the tool’s published thresholds, monthly revenue needs to clear $25,000 to be genuinely strong, with a real watch point below $12,000. Time in business clears at twelve months, with a watch point below six. Credit score clears at 600, watching below 500. These aren’t vague guidelines; they’re the exact figures the calculation scores against, published openly rather than kept as proprietary information, as most lenders do with their underwriting criteria.

Seeing the Full Picture Before You Apply

The real value of checking these numbers in advance isn’t just confirming whether a business qualifies; it’s understanding which factor, if any, is dragging down an otherwise strong outlook. A business owner with excellent revenue and a healthy credit score might still see a weaker outlook if negative balance days are running high, a detail easy to overlook without a tool that surfaces it directly.

That’s exactly what Fundivi built its free, public underwriting tool to do. A business owner enters nine specific numbers- revenue, balance, negative days, time in business, credit score, state, industry, open positions, and existing payments- and receives an immediate, factor-by-factor breakdown showing exactly where the business stands, with no credit pull and nothing submitted anywhere.

Why This Beats Applying Blind

Business owners who apply without any sense of where they stand face two common outcomes: either they avoid applying at all because they assume, often incorrectly, that their business isn’t strong enough, or they invest real time in an application that was unlikely to succeed from the start. A free, honest pre-check removes both of these problems, giving a business owner a concrete answer in minutes rather than a guess that could go either way.

This same philosophy extends to how Fundivi structures its broader hybrid funding model. Rather than a single narrow underwriting formula, Fundivi combines direct lending with a network of vetted partners, meaning a business whose numbers don’t perfectly fit one specific product still has genuine options within the same platform relationship rather than a single final no.

What This Tool Cannot See

Fundivi is direct about the limits of any public estimate. The tool cannot account for seasonality, see who a business’s customers actually are, distinguish the story behind a single difficult month, or pull an actual credit file. A real underwriting review considers considerably more than any public calculator can, which is why every result is framed as an indicative estimate rather than a warranty.

How the Seven Factors Interact With Each Other

None of these seven factors operate in complete isolation from the others. A business with exceptionally strong revenue may have more room to absorb a slightly elevated leverage percentage than a business sitting closer to the revenue threshold itself, since the underlying dollar cushion behind that leverage is considerably larger in absolute terms even at an identical percentage. A strong average daily balance relative to revenue can similarly offset a credit score sitting closer to the watch threshold than the clear one.

This means a single factor in a weaker position doesn’t automatically doom an application, especially when the remaining factors show genuine overall strength. Understanding this interaction helps business owners read their own results with the right level of nuance rather than fixating on a single number in isolation.

Common Reasons Genuinely Strong Businesses Get Declined

Some of the most frustrating declines happen to businesses that are, by any reasonable measure, genuinely healthy. A newer business with only seven or eight months of operating history might show exceptional monthly revenue, but still fall below a lender’s twelve-month time-in-business threshold. A business owner whose personal credit reflects a difficult period years earlier, unrelated to how the business is performing now, might see an application declined purely because of that legacy number.

Stacked financing is another common, often overlooked cause. A business that has taken on three or four separate financing obligations over time, each one seeming reasonable in isolation, can find that the combined leverage across all of them pushes well past what a lender considers safe, even if the business’s underlying revenue remains genuinely strong. Seeing this leverage figure clearly, before applying anywhere, gives a business owner the chance to address it directly, whether through paying down an existing obligation or consolidating multiple positions into one more manageable relationship.

Turning a Weak Factor Into a Plan

The real value of checking these numbers in advance isn’t simply the pass-or-fail answer; it’s the specific, actionable information a business owner can actually act on. A business owner who discovers their average daily balance is running thin relative to revenue can focus deliberately on building that cushion over the coming weeks before applying, rather than submitting a request today and receiving an unexplained decline. A business owner who sees negative balance days creeping above the watch threshold can address the underlying cash flow timing directly, rather than continuing to apply blind and hoping the number happens to look better than it actually is.

This kind of specific, factor-level clarity is something a traditional application process almost never provides. A decline letter from a conventional bank rarely explains which of several possible factors actually drove the outcome, leaving a business owner to guess, sometimes incorrectly, at what to fix before trying again elsewhere.

Why Publishing These Numbers Is Genuinely Unusual

Most lenders treat their underwriting criteria as a closely guarded competitive asset, disclosed only in the vaguest possible terms. Publishing specific, checkable thresholds carries real risk for a lender, since it means business owners can hold the company accountable to those exact published standards. Fundivi’s decision to do so anyway reflects a genuine bet that transparency builds more trust than secrecy ever could, even when a specific result reveals a genuine weakness alongside a business’s real strengths.

Frequently Asked Questions

Can checking my numbers hurt my credit score?

No. The underwriting tool performs no credit pull. It calculates entirely from the numbers you enter, and nothing is transmitted or stored.

What if my numbers fall just below a threshold?

A single factor landing near a watch threshold doesn’t necessarily mean a decline. Underwriting evaluates a business’s complete picture, and genuine strength in other areas can offset a single weaker factor. The tool’s breakdown shows exactly which factor to focus on to strengthen your outlook.

Is this the same as a real loan application?

No. This is an educational, indicative tool, not an application, an offer, or a credit decision. It’s designed to help you understand where you stand before deciding whether to move forward with a real request.

How accurate is the estimate compared to a real underwriting decision?

The published thresholds reflect a genuine, public benchmark, but Fundivi makes it clear that any specific lender, including Fundivi itself, sets its own criteria during a full application review. Treat the estimate as directional, not final.

What should I do if my outlook looks weak on a specific factor?

Focus on that specific factor directly. If leverage is high, consider paying down an existing obligation before applying. If average daily balance is thin, building a stronger cash cushion over a few months can meaningfully shift the outlook before you ever submit a real request.

Getting Started

Business owners curious about where they genuinely stand can check their numbers directly through Fundivi’s self-underwriting tool, see which product might actually fit their needs using the product matching calculator, and once an offer is in hand, confirm its true cost using the annualized cost calculator. For business owners who want to understand the products themselves in more depth before running any numbers, Fundivi’s guide library covers each funding option in plain language.

Disclaimer: This content is for general informational purposes only and should not be considered as financial advice. The content is not intended to be a substitute for professional financial advice, investment advice, or any other type of advice. You should seek the advice of a qualified financial advisor or other professional before making any financial decisions.