Economic Insider

The Real Cost of Aging in Place vs. Moving to an Independent Living Community


When thinking about extended retirement, many older adults initially assume that staying in their longtime family home (an approach commonly called aging in place) is the most economical and comfortable choice. After all, if your mortgage is paid off, remaining where you are can feel practically free.

However, a closer look at the true costs of maintaining an aging home reveals that aging in place is often far more expensive, demanding, and isolating than anticipated.

When you compare the ongoing line-item costs of homeownership with the all-inclusive value of an independent living community, the financial and lifestyle comparison changes dramatically.

The Hidden Line Items of Aging in Place

A home without a mortgage still incurs significant monthly and annual carrying costs. These expenses tend to accelerate as both the homeowner and the property get older.

1. Property Taxes and Insurance

Real estate property taxes and homeowners’ insurance premiums rarely stay flat. In many regions, insurance rates have risen sharply in recent years, and they remain a fixed expense that offers no return on quality of life. Even if you pay off your mortgage, you still have to pay taxes and insurance.

2. Routine and Emergency Home Maintenance

Maintaining a single-family house requires ongoing spending on landscaping, lawn care, snow removal (if applicable), gutter cleaning, pest control, HVAC maintenance, and trash service. Major structural components also eventually fail. Replacing a roof, installing a new furnace, or repairing plumbing can cost tens of thousands of dollars in unexpected out-of-pocket expenses.

3. Home Modifications for Accessibility

Standard single-family homes are rarely built for aging adults with evolving mobility needs. Making a multi-level house safe often demands substantial capital renovations, including:

  • Installing walk-in showers and grab bars
  • Widening doorways for walkers or wheelchairs
  • Adding exterior wheelchair ramps or stair lifts
  • Converting ground-floor rooms into primary bedrooms

These renovations can cost anywhere from $10,000 to over $100,000, and they rarely increase the home’s resale value.

4. Food, Utilities, and Transportation

Budget heating, cooling, water, internet, cable, and groceries individually. When driving becomes difficult or unsafe, private transportation or rideshare services add yet another layer of recurring cost.

The Unplanned Price of In-Home Care

The biggest financial risk of aging in place is the eventual need for personal care. When assistance with medication management, bathing, or meal preparation becomes necessary, families must hire in-home care agencies.

Private non-medical home care currently averages $30 or more per hour across the United States. Just 20 hours of weekly help can add $2,500 to your monthly budget. If around-the-clock care or skilled nursing is required, in-home support can quickly exceed $15,000 to $20,000 per month, rapidly draining retirement savings and placing enormous physical and emotional pressure on adult children.

The Predictable Value of Independent Living

Moving to an independent living community such as those operated by the not-for-profit organization Acts Retirement-Life Communities replaces unpredictable homeownership expenses with a single, predictable monthly fee.

Consider what is included in that single payment:

  • All interior and exterior maintenance: You never have to mow the lawn, paint shutters, or pay a repair technician again.
  • Flexible dining plans: Enjoy chef-prepared meals daily in elegant campus restaurants without grocery shopping, kitchen cleanup, or restaurant price markups.
  • Included utilities and services: Water, trash, sewer, TV, internet, scheduled campus transportation, and security are bundled together.
  • Resort-style amenities: Access to on-site fitness centers with personal trainers, swimming pools, creative art studios, libraries, and lush walking paths are included.
  • Vibrant social engagement: Daily calendars filled with guest lectures, clubs, cultural outings, and social gatherings help combat the physical and cognitive health risks linked to senior isolation.

The Life Care Difference

The greatest financial distinction between staying home and choosing an Acts community is the coveted Type A Life Care contract. In an Acts community, if you or your spouse’s health needs ever change, you have access to on-campus assisted living and skilled nursing care with no increase to your monthly fee solely because of an increase in needed support.

Instead of scrambling to find and fund emergency care at home, you have a plan already in place, one built to support your independence and give your family a clear path forward if health needs change.

The Real Bottom Line

Aging in place often looks inexpensive only when everything goes right. The moment home repairs mount, driving stops, or personal care becomes necessary, the financial and emotional balance shifts.

Independent living is an intentional choice to live actively today while protecting yourself from tomorrow’s uncertainties.

Compare Your Current Expenses with Acts Retirement

Take the guesswork out of your retirement planning. Find more resources about how to live a fulfilling yet affordable retirement life.

When you’re ready, check out any of Acts’ 28 communities in 9 states to see what resort-style retirement living looks like.

Disclaimer: Cost figures in this article are general estimates for informational purposes and will vary by location, individual circumstances, and community. They are not guarantees of actual cost, and contract terms and fees are governed by each community’s residency agreement. This article does not constitute financial, legal, or medical advice.


One in Four Older Adults Falls Every Year: Mike Link and Kami Vision Are Testing Whether a Camera Beats $10,000 a Month

Tab 3

American households carry a financial exposure most have never priced. It arrives without warning, it compounds, and by the time anyone runs the numbers the decision has usually been made for them.

The exposure is a fall, and the surrounding data is unusually complete.

Key Takeaways

  • One in four Americans aged 65 and over falls each year, according to CDC data, and fall-related healthcare spending exceeds $80 billion annually.
  • A single fall-related hospital admission averages around $30,000, and frequently precedes a transition into long-term care.
  • Nursing homes with private rooms average over $10,000 a month, while assisted living runs close to $6,000 and rose 10 percent in 2024.
  • AARP research finds 77 percent of adults over 50 intend to remain in their own homes as they age.
  • Kami Vision deployed fall detection across senior living facilities from early 2022 before beginning a consumer rollout scheduled for the second half of 2026.

Those figures describe a market forming around the gap between what an ageing population wants and what it can afford. What follows is how one company spent four years preparing to occupy it.

The Cost Nobody Budgets For Until It Arrives

Falls occupy an unusual position in American health economics. The data is comprehensive, the trajectory well understood, and almost no household plans for one.

Every 11 seconds, an older adult arrives at an emergency room following a fall. Federal data puts fall-related healthcare spending above $80 billion annually, and a single admission averages around $30,000.

Here is what that $30,000 conceals. It is not the cost of the fall. It is the entry fee. A hip fracture at 78 rarely ends at discharge, because the person who goes home is not the person who left. Mobility narrows, confidence goes, and a family managing at a distance is suddenly deciding on a deadline. The one-time expense becomes a monthly one, and it does not stop. Few household balance sheets absorb a line item that begins in an emergency room and continues for years.

Delaying a Nursing Home by One Year Is Worth $70,000

The senior care market has historically presented families with a binary choice, and both options are expensive. Nursing homes with private rooms average over $10,000 a month. Assisted living runs close to $6,000, with costs rising 10 percent in 2024 alone, outpacing inflation against retirement savings already under pressure.

Set against that, the economic case for monitoring technology is not primarily about improving outcomes, though it may. It is that reducing the probability of an undetected fall also reduces the probability of the transition that often follows one. At current assisted living rates, delaying that transition by twelve months is worth more than $70,000.

More than 61 million Americans are now 65 or older, a group that expanded 13 percent between 2020 and 2024. AARP research finds 77 percent of adults over 50 intend to age in their own homes. The infrastructure supporting that preference has not kept pace, and the gap between what people want and what they can afford is where this market sits.

Photo Courtesy: Kami Vision

Four Years in Care Facilities Before a Single Living Room

KamiCare entered senior living communities and skilled nursing facilities in early 2022 and expanded through 2025. That sequence, institutional before consumer, is the opposite of how most consumer health technology reaches the market, and it produced operating data no beta programme could replicate. The platform detects ground-level events at 99.5 percent accuracy, built on thousands of documented fall incidents recorded in professional care environments rather than laboratory conditions.

It also asks nothing of the person it protects, and that is the line separating this from everything else on the market. The medical alert pendant has been the default for decades, and it carries a design flaw nobody has solved: it requires someone disoriented, injured or unconscious to perform a deliberate action. The moment help is most needed is the moment the user is least able to summon it. Passive detection removes the person from the equation. The system does not wait to be told something has happened, because it already knows.

It reads more than sudden falls, identifying an inability to rise unassisted, a person moving across a floor without standing, and early indicators that mobility support may be needed. For operators, that converts a safety device into a care planning instrument, which is where facility economics are decided.

Kami Vision holds 60 patents in computer vision and camera technology, developed across years of enterprise deployment, which raises the cost of entry for anyone approaching senior safety from a standing start.

Facilities Buy on Risk. Families Buy on Peace of Mind.

The consumer version entered beta testing in United States homes during 2025, with full rollout expected in the late part of 2026 and early 2027. Mike Link, chief operating officer at Kami Vision, has described the approach to that launch as partnership-led rather than dependent on direct-to-consumer marketing alone.

The reasoning is about how this category reaches people. Nobody wakes up intending to buy fall detection. It enters a family’s life through someone they already trust, a physician, a discharge planner, a care provider, usually within days of an incident that frightened everyone. Those channels arrive at the moment the decision is live, rather than paying to interrupt people who are not yet thinking about it.

That difference in buyer is the central commercial challenge. A facility purchases on a risk calculation: liability exposure, staffing ratios, regulatory obligation. A family purchases because a daughter has started calling her mother twice a day and still lies awake. One decision is reached on a spreadsheet. The other is not.

The home product adds live view and two-way audio, neither of which a staffed facility required. The privacy architecture carried over unchanged: recording occurs only during detected events, and unobscured footage goes exclusively to authorised family members. Alerts reach the resident first, then designated contacts, with an option to call 911 through the application.

Six Million Users Already Run on This Platform

The underlying infrastructure is not being built for this launch. It already carries load.

Operating from Palo Alto and engineering these systems since 2020, Kami Vision serves six million users across 120 countries and 15 million devices, processing 248 million daily alerts and 25 petabytes of data. An early growth round of $10 million from East West Bank funded that buildout.

The same Vision AI foundation supports Kami Pro Security for commercial premises and KamiCloud for notifications and storage, diversifying revenue while compounding investment in core detection. At CES 2026 the company introduced a companion smart ring tracking heart rate, blood oxygen and sleep, extending coverage beyond the range of a fixed camera.

Photo Courtesy: Kami Vision

The Arithmetic Is Settled. The Adoption Is Not.

The demographic mathematics are not a forecast. They are already in motion, and healthcare costs are moving with them.

What remains unproven is whether households convert that arithmetic into purchasing decisions at a price point they will absorb. What has been proven is the technology, over four years, in the environments where falls are most frequent and most consequential.

The rollout in late 2026 is the test of whether institutional validation translates into commercial scale.

Care providers and families can review the fall detection platform or request a demonstration through the company’s site.

China Export Growth Accelerates as U.S. Shipments Rise

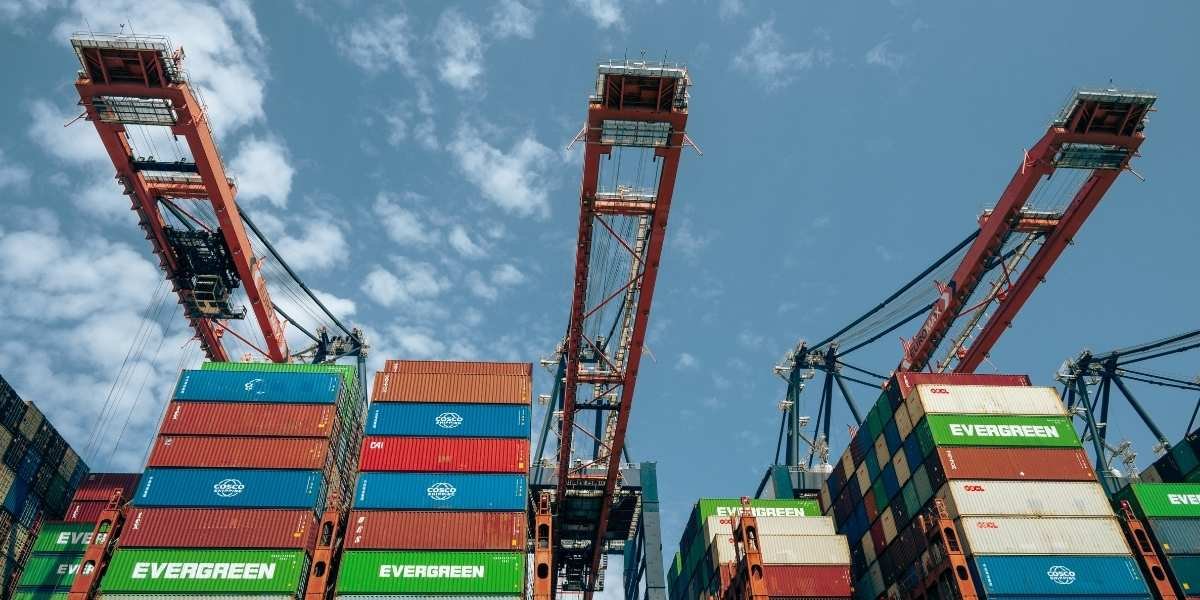
China’s exports rose 25% year over year in August, while shipments to the United States increased 34.4%, according to Chinese customs data released September 8. Imports also accelerated, giving the latest figures added relevance for U.S.-China trade flows and the economic effects of tariff policy.

Key Takeaways

  • China’s exports increased 25% year over year in August, compared with 23.9% growth in July.
  • Chinese imports rose 28.2% in August, up from 27.5% in July.
  • Exports from China to the United States increased 34.4% year over year.
  • China’s trade surplus with the United States reached $29.18 billion in August.
  • High-tech exports increased 42.9% during the first eight months of 2026.

China’s August Export Growth Accelerates

China’s export growth accelerated to 25% year over year in August, according to customs data released September 8. The increase followed a 23.9% rise in July and matched the 25% growth forecast cited in the reported data.

The August figure indicates that the value of goods shipped from China to overseas markets increased at a faster annual pace than in the previous month. Export activity remained a source of support for China’s external trade during the month.

Imports also recorded faster growth. Chinese imports increased 28.2% year over year in August, compared with a 27.5% increase in July.

The simultaneous increases in exports and imports provide a broader view of China’s trade activity than exports alone. The August figures show stronger year-over-year movement on both sides of the country’s international goods trade.

Recent coverage of China’s July shipments also examined the relationship between stronger Chinese exports and U.S. factory activity, providing context for the latest August figures. 

The data also include a strong technology component. High-tech exports increased 42.9% during the first eight months of 2026, according to the reported customs figures.

China’s semiconductor exports more than doubled in value during that eight-month period. Vehicle exports also increased by more than 50% in both value and volume.

U.S.-Bound Chinese Exports Increase 34.4%

Exports from China to the United States increased 34.4% year over year in August. The increase was substantially faster than China’s overall export growth of 25% during the same month.

The August figure provides a new measurement of bilateral goods trade between the two economies. It also shows that U.S.-bound shipments increased even as trade policy remained a significant factor in the commercial relationship.

The reported data showed that China’s imports from the United States grew more slowly than its exports to the American market. That difference contributed to a wider Chinese goods surplus with the United States during August.

The figures are based on Chinese customs data covering the month of August. They provide a monthly snapshot of the value of goods moving between the two countries rather than a measure of services trade or total economic activity.

The increase in U.S.-bound shipments also gives businesses and policymakers a current reference point for assessing bilateral trade flows. Importers, manufacturers and other companies exposed to cross-border goods trade can use monthly trade data to track changes in the volume and direction of commercial activity.

Earlier analysis of tariff-related trade activity has also examined how changes in U.S. trade policy can affect imports, inventories and supply-chain indicators. 

The August numbers are particularly relevant to the U.S. because China remains a major source of manufactured goods and technology products for American businesses and consumers. The trade figures therefore provide direct information about the continuing flow of Chinese goods into the U.S. market.

China’s Trade Surplus With the U.S. Reaches $29.18 Billion

China recorded a $29.18 billion trade surplus with the United States in August, according to the customs data. The figure represents the difference between the value of China’s exports to the United States and its imports from the U.S. during the month.

China’s exports to the United States increased 34.4% year over year, while the value of U.S. goods entering China grew at a slower rate. The resulting surplus provides another measure of the imbalance in bilateral goods trade.

The monthly figure is separate from China’s overall global trade balance. It specifically measures trade in goods between China and the United States during August.

The bilateral surplus also adds context to the overall export figures. China’s exports increased across international markets, but the U.S. market recorded a particularly strong increase in shipments during the month.

Trade balances can change from month to month as export values, import demand, commodity prices, production and purchasing patterns change. A single monthly surplus therefore measures activity during a defined period rather than determining the direction of future trade.

The August data nevertheless provide a new reference point for assessing the scale of bilateral goods flows. They also offer a basis for comparing U.S.-China trade activity with China’s broader international trade performance.

The figures come as the two countries continue to manage tariffs and other trade measures affecting cross-border commerce. Changes in those policies can affect the cost and composition of goods moving between the two markets.

High-Tech Shipments Drive Part of China’s Export Growth

High-tech products accounted for a significant portion of China’s export gains during the first eight months of 2026. High-tech exports increased 42.9% over that period, according to the reported customs figures.

Semiconductor exports more than doubled in value during the first eight months. The increase places semiconductor shipments among the technology categories contributing to the stronger export figures.

Vehicle exports also increased by more than 50% in both value and volume during the period. The data therefore cover several major manufacturing categories rather than being concentrated in a single product group.

The technology figures are relevant to U.S.-China trade because high-tech goods are an important component of bilateral commercial activity. Changes in semiconductor and other technology exports can affect import patterns for businesses that rely on international manufacturing and supply networks.

The export figures also distinguish the performance of technology and vehicle shipments from China’s overall trade numbers. Total exports grew 25% in August, while high-tech exports recorded a faster cumulative increase during the first eight months.

The customs data do not establish that every technology category experienced the same rate of growth. The reported figures specifically identify high-tech exports, semiconductor exports and vehicle exports as areas with strong increases.

For U.S. businesses, the figures provide current information on the availability and movement of goods produced in China. Companies that purchase imported components or finished products can be affected by changes in trade volumes, tariffs and cross-border costs.

U.S.-China Trade Flows Remain Central to the Data

The August figures place U.S.-China trade within a wider increase in China’s international trade activity. Total exports grew 25% year over year, while exports to the United States rose 34.4%.

China’s imports also accelerated to 28.2% in August from 27.5% in July. The combination of faster exports and imports indicates increased year-over-year movement on both sides of China’s goods trade.

The U.S. figures are distinct because shipments to the American market grew faster than China’s overall exports. The $29.18 billion bilateral surplus further separates the U.S. trade relationship from China’s aggregate trade position.

The reported customs data also show that China’s export performance includes strong increases in high-tech products and vehicles. High-tech exports rose 42.9% during the first eight months, while semiconductor export values more than doubled and vehicle exports increased by more than 50% in value and volume.

These figures provide measurable information for evaluating U.S.-China trade rather than relying on broader assessments of the bilateral relationship. Monthly export, import and trade-balance data allow changes in commercial flows to be tracked using reported figures.

The August results also establish several indicators for subsequent trade data. Future releases can be compared with the 25% overall export growth rate, the 34.4% increase in U.S.-bound exports and the $29.18 billion bilateral surplus recorded in August.

For businesses involved in cross-border trade, the data provide a current measure of the goods flowing between the two economies. For policymakers and economic analysts, the figures add to the available evidence on the scale and composition of U.S.-China merchandise trade.

Frequently Asked Questions

How much did China’s exports grow in August 2026?

China’s exports increased 25% year over year in August 2026. That compared with 23.9% growth in July.

How much did China’s exports to the U.S. increase in August?

China’s exports to the United States increased 34.4% year over year in August 2026. The increase was faster than China’s overall export growth during the month.

What was China’s trade surplus with the United States in August?

China recorded a $29.18 billion trade surplus with the United States in August 2026. The figure represents the difference between Chinese exports to and imports from the U.S. during the month.

How much did China’s high-tech exports increase in 2026?

China’s high-tech exports increased 42.9% during the first eight months of 2026. Semiconductor exports more than doubled in value over the same period.

How did China’s imports perform in August 2026?

Chinese imports increased 28.2% year over year in August. That was higher than the 27.5% growth recorded in July.

Bare Land Attracts Far Less Bidding Competition Than Existing Apartments

By: KeyCrew Media

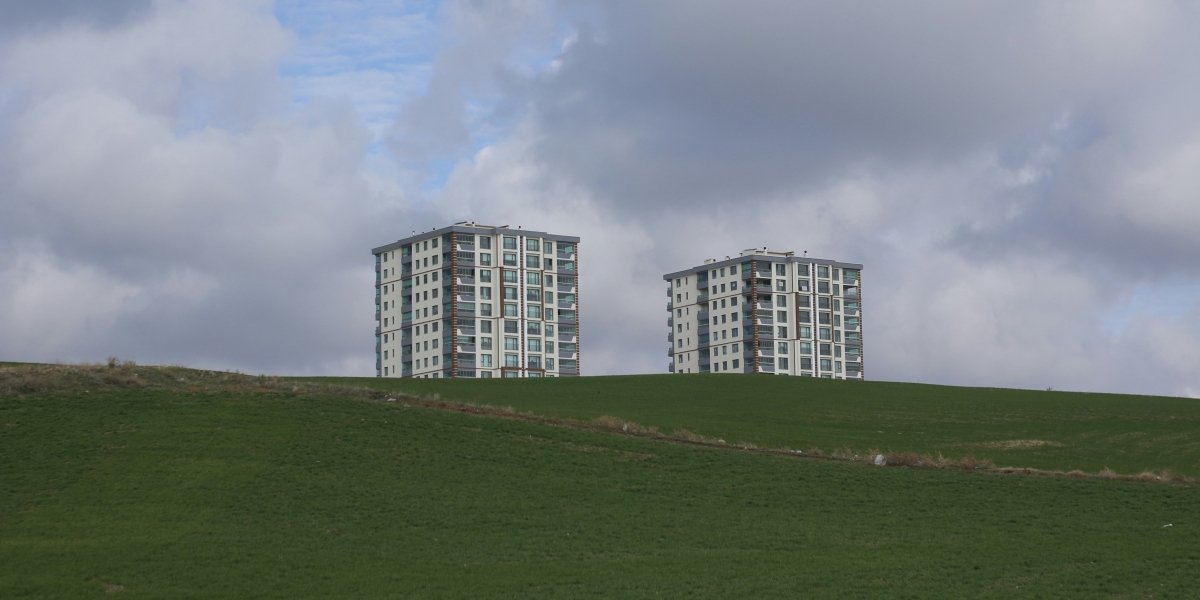
Institutional and private buyers compete energetically for stabilized multifamily assets, keeping prices near fair market value. According to Dusten Hendrickson, Founder & President of Mailbox Money Real Estate & Private Equity, the market for developable bare land offers a different and appealing set of competitive conditions: fewer bidders, favorable relative pricing, and structural cost advantages that carry through the life of a deal.

Why Acquisition Prices Stay High

The strong volume of capital pursuing existing apartment buildings means acquisition investors often price close to market and rely on market timing. “There’s tons of competition for acquiring assets,” Hendrickson says. “You’re going to pay a lot closer to market rate.”

Most investors, institutional or individual, prefer income-producing assets they can underwrite immediately. Bare land is a longer-term play that involves entitlement work and development expertise, which naturally means fewer buyers compete for developable land than for stabilized properties.

“There’s a lot less people bidding on bare land than there are on existing apartments to buy,” Hendrickson says. That reduced competition allows developers to acquire land at prices that reflect actual development economics.

Development Complexity Filters Out Most Competitors

Bare land attracts fewer bidders because ground-up development rewards a specialized skill set. Entitlement work, construction management, lease-up execution, and the multi-year timeline before distributions begin all draw on specialized knowledge and operational infrastructure.

“The barrier to entry is way higher in development,” Hendrickson says. For experienced developers, this complexity functions as a competitive moat; the same expertise required to participate helps keep land prices grounded in development economics rather than bid up the way stabilized asset prices are.

Hendrickson also notes that the existing apartment inventory available for purchase reflects the assets owners choose to bring to market. “Most people do not sell their best assets,” he says. “Most people sell their worst assets, keep their best assets unless they’re in big trouble.” Development, by contrast, lets a builder create a brand-new, high-performing property in a location of their choosing.

Forced Appreciation vs. Market-Dependent Returns

Ground-up development relies on value created through construction and lease-up rather than market appreciation compared with buying existing assets. When a developer builds a new property, leases it up, and stabilizes it, the value created results directly from producing income-producing leases where none existed before, not solely from market appreciation.

“When you create leases, you’re creating more value than when you improve leases,” Hendrickson says. Development returns rely more on execution than on market timing. A developer who executes well creates value through construction and lease-up across a range of market conditions.

Hendrickson acknowledges that macro conditions still influence when a project should be sold and what it will be worth. Forced appreciation provides a durable return component. “Ours is less about timing,” he says. “When you acquire, it’s more about timing.”

How Mailbox Money Structures Projects

Hendrickson’s firm builds its strategy around the land acquisition advantage and forced appreciation. The firm closes on land only after entitlement is secured, the point at which, in Hendrickson’s view, the majority of project risk has already been resolved. Construction begins immediately at closing. In one recent project, crews were on site digging within two hours of the transaction completing.

The firm targets locations where population growth, employment, and amenity density support long-term rent demand. “We build in the best neighborhoods where the path of progress is, where all the amenities are, where all the restaurants are, where the new offices are, the big box stores,” Hendrickson says.

New construction also carries lower near-term maintenance costs than acquired properties. A 10-year-old apartment project is still relatively new by multifamily standards, and a ground-up project starts with zero deferred maintenance and modern design suited to current renter expectations.

Comparing Development and Acquisition Timelines

Ground-up development and acquisition differ most in when returns materialize. In a development project, the early years go toward entitlement, construction, and lease-up before a property stabilizes. Hendrickson notes that distributions typically begin around the two-year mark, whereas acquiring an existing, occupied building can generate rental income from the first month. The firm’s project portfolio documents developments built on this approach.

The distinction reflects where each approach draws its value. Acquisition leans on buying at the right moment in the market. Development, by contrast, builds value through the work itself, securing land at development-economics pricing, then constructing and leasing property where none existed before.

About Mailbox Money Real Estate: Mailbox Money Real Estate is a vertically integrated multifamily development firm led by Dusten Hendrickson, building workforce and attainable housing across the Midwest. The company has developed more than 1,300 units, focusing on market-rate, wellness-designed apartments in overlooked and underserved communities.

Disclaimer: This article is based on information provided by the expert source cited above. It is intended for general informational purposes only and does not constitute legal, financial, or real estate advice. Readers should conduct their own research and consult qualified professionals before making any real estate or financial decisions.